|
On-line demos Project manager |
Editors Debugger |
White paper Brochure |
  |

|
|||||
|
SDL-RT debugger Code generation Code generation is available for the whole SDL-RT system or for a sub-part of it such as a block or a task. SDL-RT concepts are translated to ANSI C code and embedded C code is copied as written in the design to the generated files. That makes a legible generated C code for the whole system. A makefile is generated that includes all the other concerned files gathered in the Project manager including C source and header files. External object files can also be linked to the final executable. Code generation profiles are available making the switch from debug on host to final downloadable target executable a click away. Supported RTOS are: The generated code is fully documented and any proprietary RTOS or scheduler can be integrated.
Simulation or debug on target can be done at SDL-RT graphical level or in the very legible generated source code. To do so Real Time Developer Studio relies on native and cross C debuggers such as: SDL-RT code coverage At any time during a debug session it is now possible to view graphically the SDL-RT code coverage at all architecture level. You can see how many times a transition has been fired, how many times a state has been reached, and how many times a symbol has been executed. 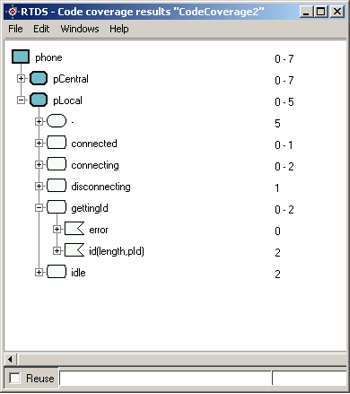 Automatic conformance checking MSC specifications can be automatically translated in an SDL-RT test process to check the system is conform to the requirements.  |
Debugger GUI To offer graphical debugging, the tool uses a C debugging environment in the background. RTOS system calls are already integrated in the generated code and to start the SDL-RT debugger is as simple as a mouse click. The SDL-RT debugger displays key internal information such as :
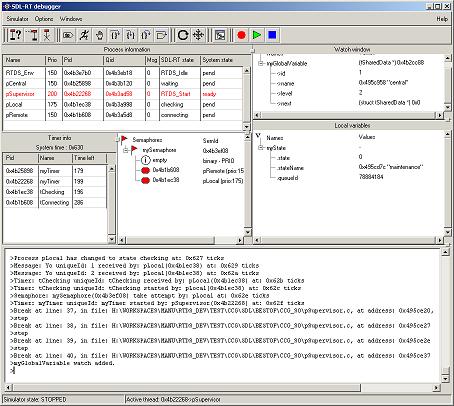 SDL-RT debugger GUI
It is possible to step graphically or in the very legible generated C code and to switch from one representation to the other:
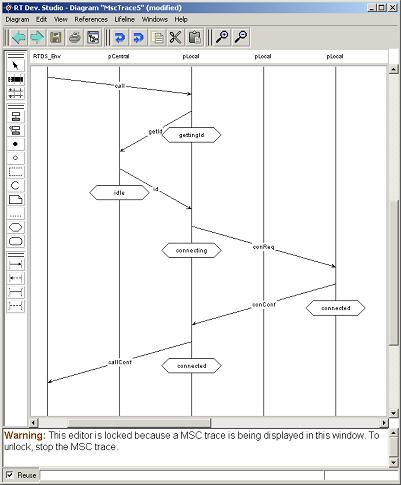
 A live MSC trace can be generated to visually monitor the system under test:
 |